
In short
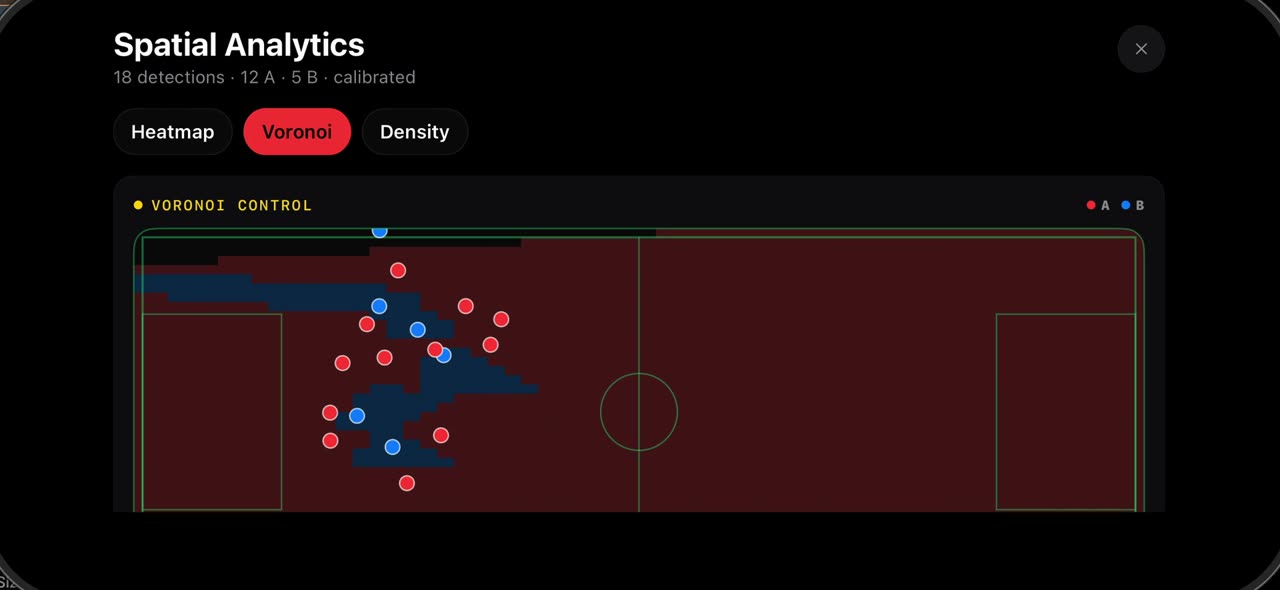
Open Studio and tap Spatial Analytics. The heatmap shows where Team A spent the match on the calibrated pitch, built from every player the scan tracked. Voronoi splits the pitch into the areas each side controlled, A against B, so you can see which team owned the middle and which one lived on the flanks. Density shows how compact the block was; switch between attacking and defending and compare the two sides. Everything stays on your device. iPhone and iPad.
Step by step
Heatmap
Open Studio and tap Spatial Analytics. The heatmap shows where the first team spent the match on the calibrated pitch, built from every player found in the scan.
On screen: Studio → Spatial Analytics: where Team A spent the match, on the calibrated pitch.
Voronoi
The second tab splits the pitch into the areas each side controlled, team A against team B, so you can see which team owned the centre and which one lived on the flanks.
On screen: Voronoi: the areas each side controlled, A against B.
Density
Density shows how compact the block was. Switch between attacking and defending from the menu, compare the two sides, and close when you have the picture.
On screen: Density: how compact the block was. Switch sides from the menu, then close.
What you need
- An iPhone or iPad with iOS 17 or later (or a Mac).
- TacticalSnap from the App Store. It is free to download and every analysis tool is free.
- A match video in Photos or Files. Any camera works, even a phone on the touchline.
Try it on your own footage
TacticalSnap runs the whole loop on an iPhone or iPad, on the device. Analysing is free and unlimited; exporting video is the only paid step.
More in this section
 0:40
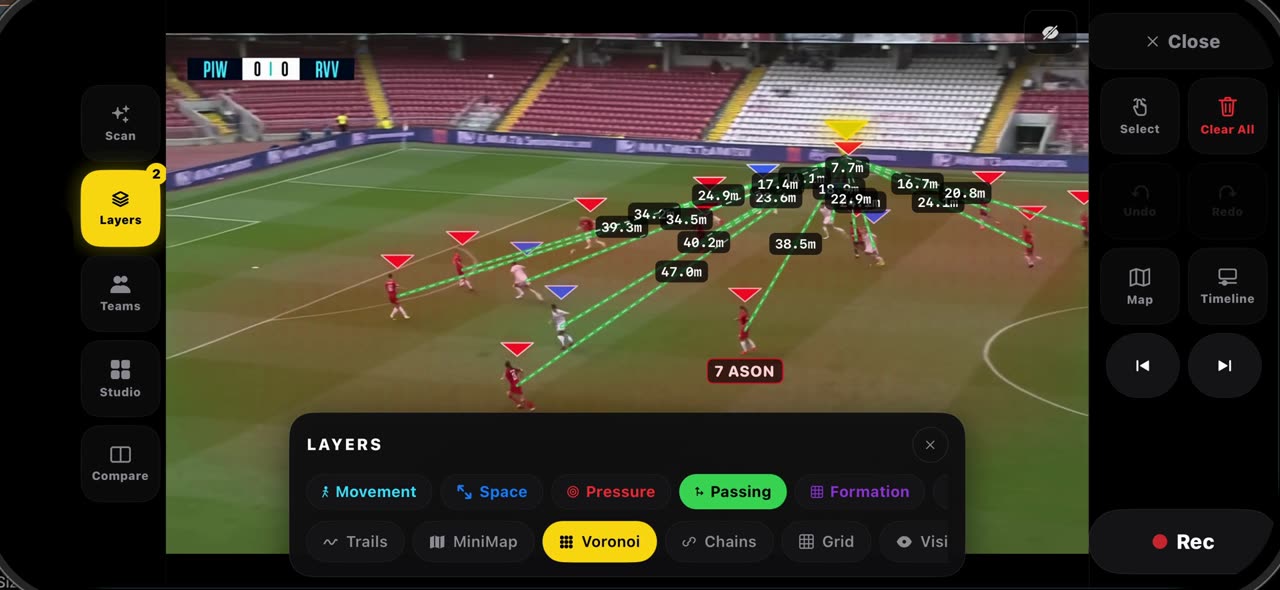
0:40How to read a frozen frame with the layers in TacticalSnap
Open Layers on a frozen frame.
 0:34
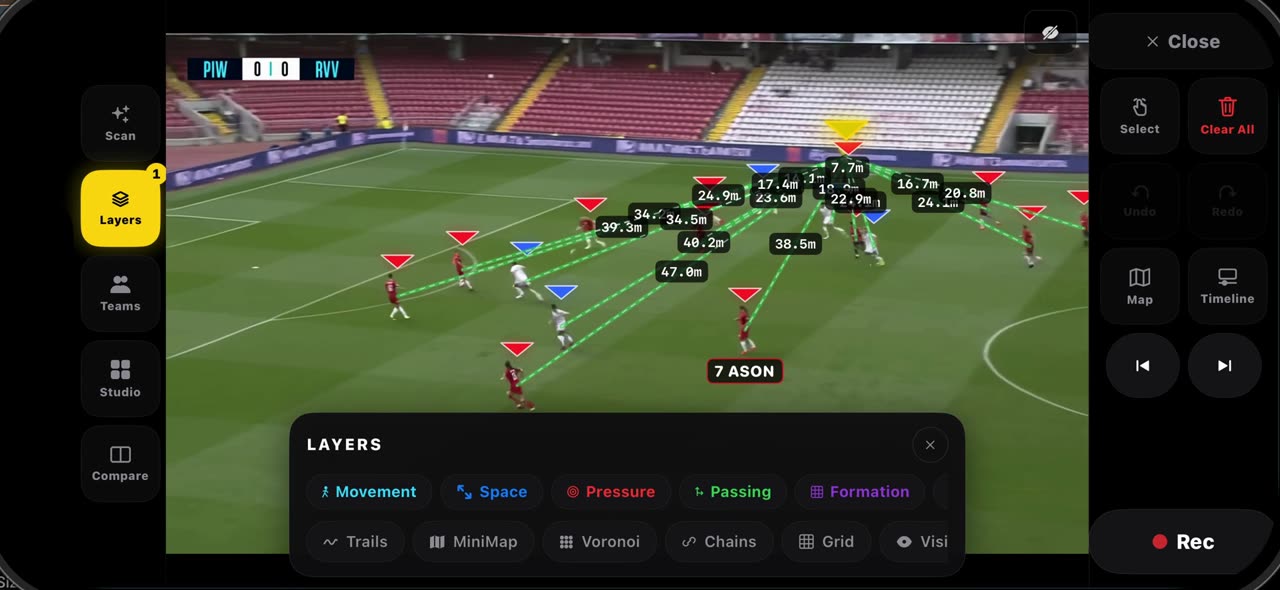
0:34How the pitch is calibrated in TacticalSnap, and what it gives you
When you freeze a frame, the lines of the pitch are read and the frame is calibrated by itself — no corners to tap; the badge at the top says when…
 0:34
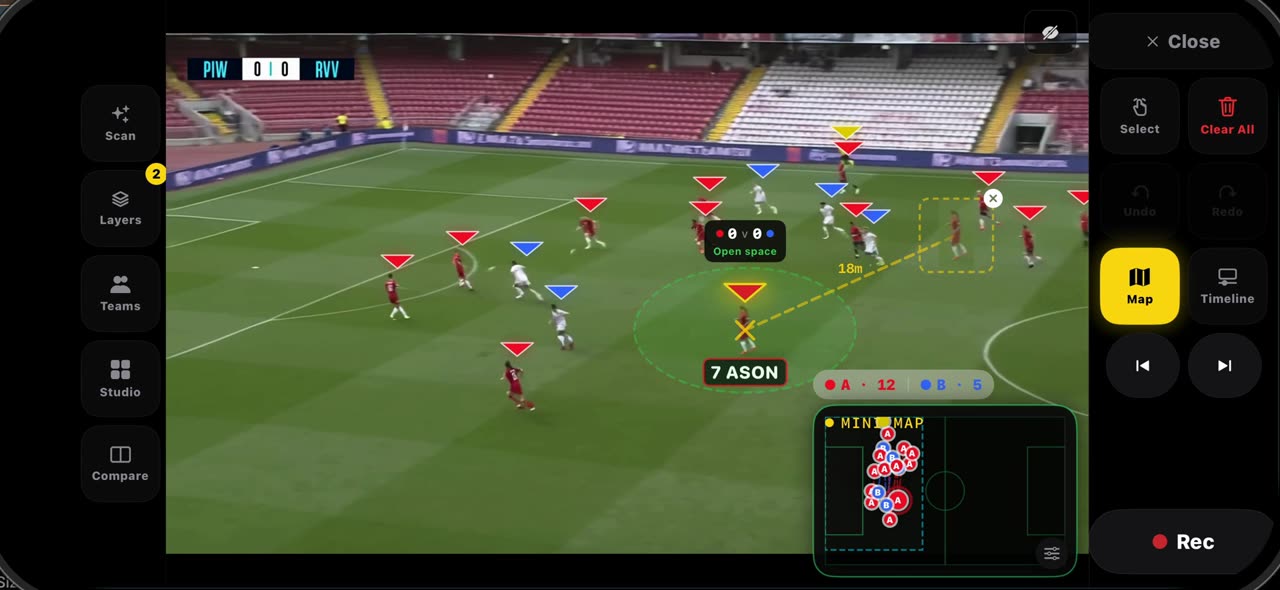
0:34How to use ghost players and Connect in TacticalSnap
Hold your finger on a player on a frozen frame and pick Ghost: a translucent copy of him, cut from the frame, appears next to the real one with a…
 0:33
0:33How to read the match report in TacticalSnap
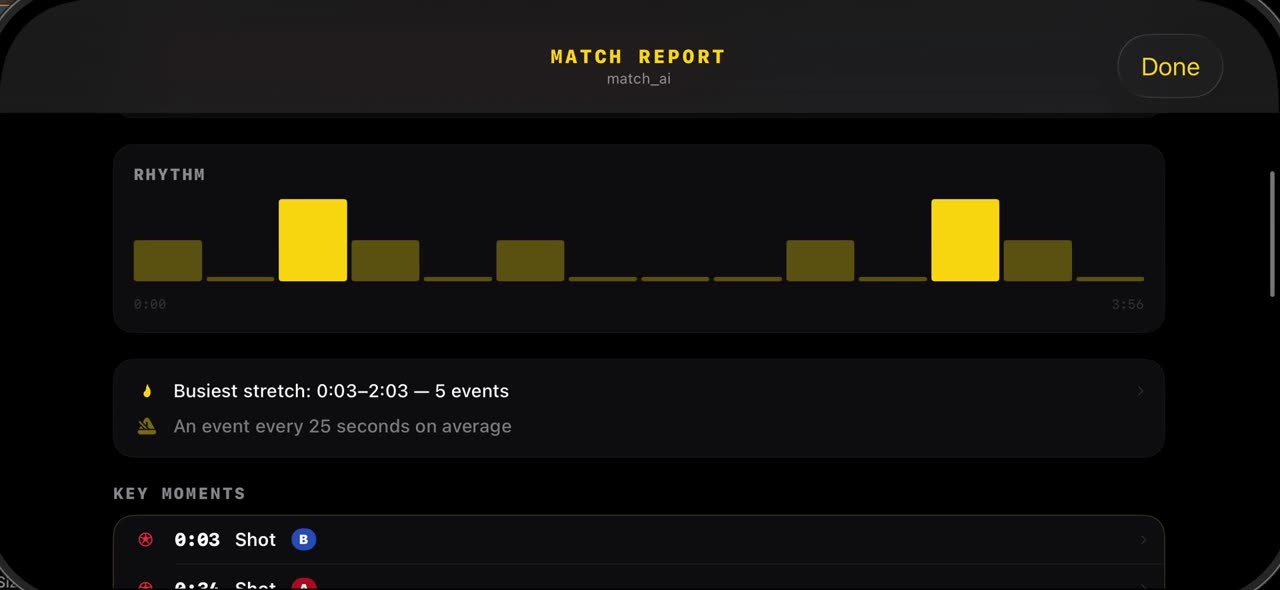
After the scan, open Studio and tap Match Report: the shots the scan found, the possession split and the rhythm of the game are already there, from…
 0:38
0:38How to use the Tactical Board and Hand-Drawn mode in TacticalSnap
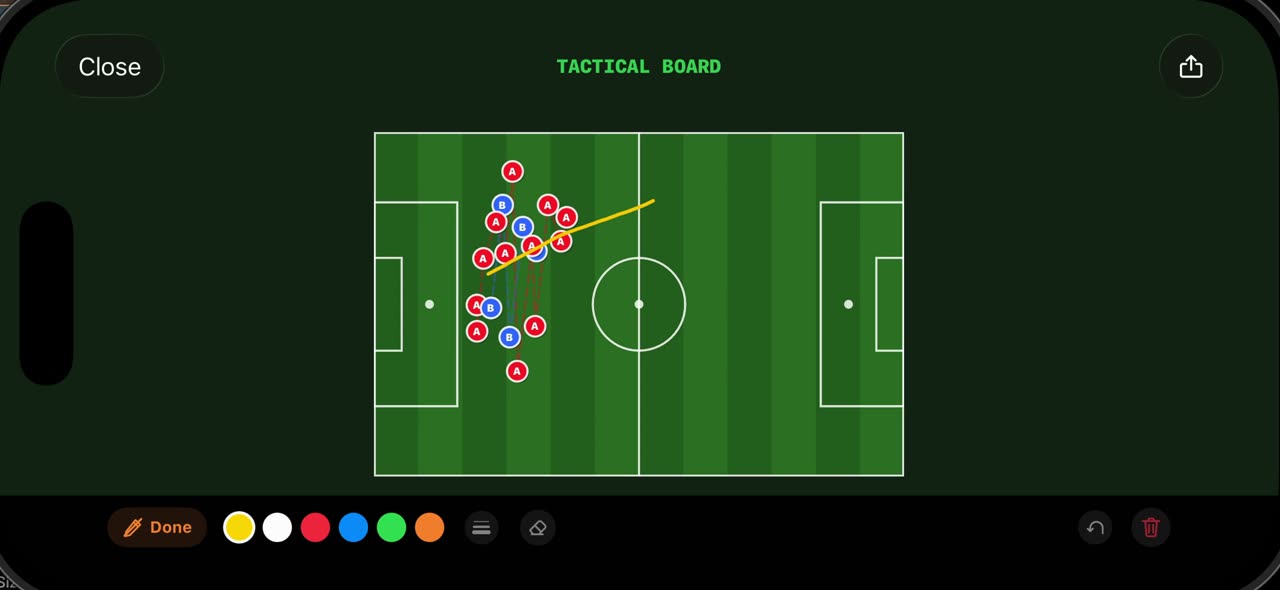
Open Studio on a frozen frame and tap Tactical Board: the frame is redrawn as a 2D board from above, with every player the scan found placed where…
 0:38
0:38How to compare two moments of a match in TacticalSnap
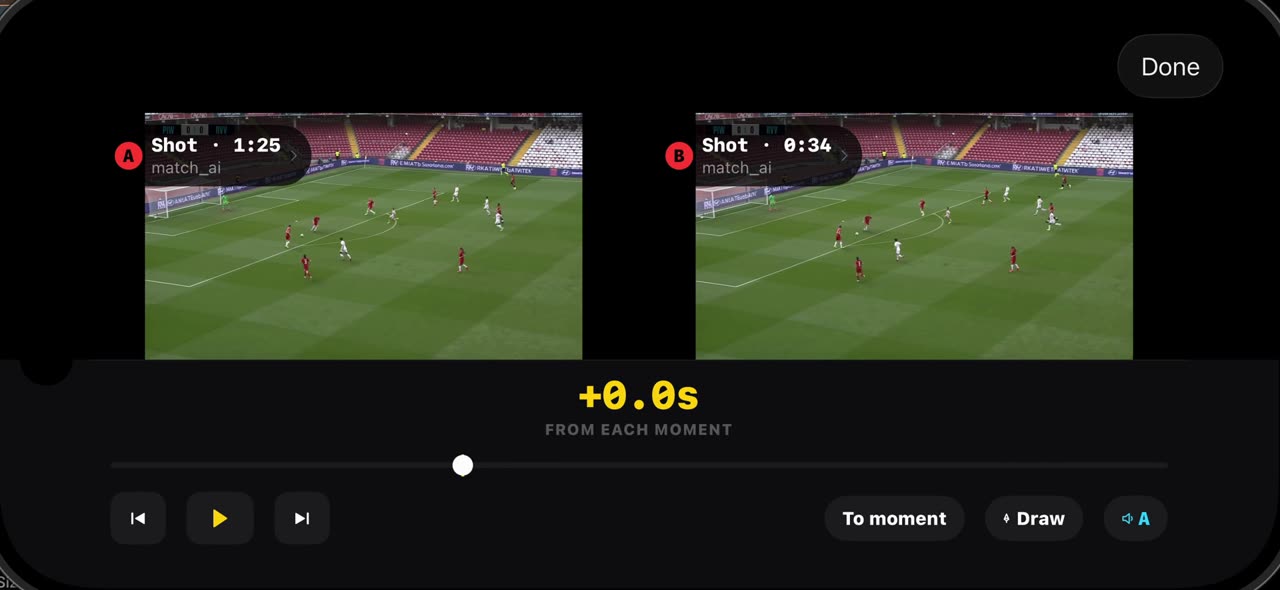
Compare puts two moments of your own match side by side.